> ## Documentation Index
> Fetch the complete documentation index at: https://wb-21fd5541-serverless-sft-revamp.mintlify.site/llms.txt
> Use this file to discover all available pages before exploring further.
# Reports の概要
> 機械学習 プロジェクト のための、プロジェクト管理およびコラボレーション ツール
export const TryProductLink = ({url}) =>
Try in W&B
;
export const ColabLink = ({url}) =>
Try in Colab
;
W\&B Reports を使用すると、以下のことが可能になります:
* Runs の整理。
* 可視化(visualization)の埋め込みと自動化。
* 分析による 学び の記述。
* コラボレーターとの進捗共有(LaTeX の zip ファイルや PDF 形式)。
以下の画像は、トレーニング中に W\&B に ログ された メトリクス から作成された レポート の一部を示しています。
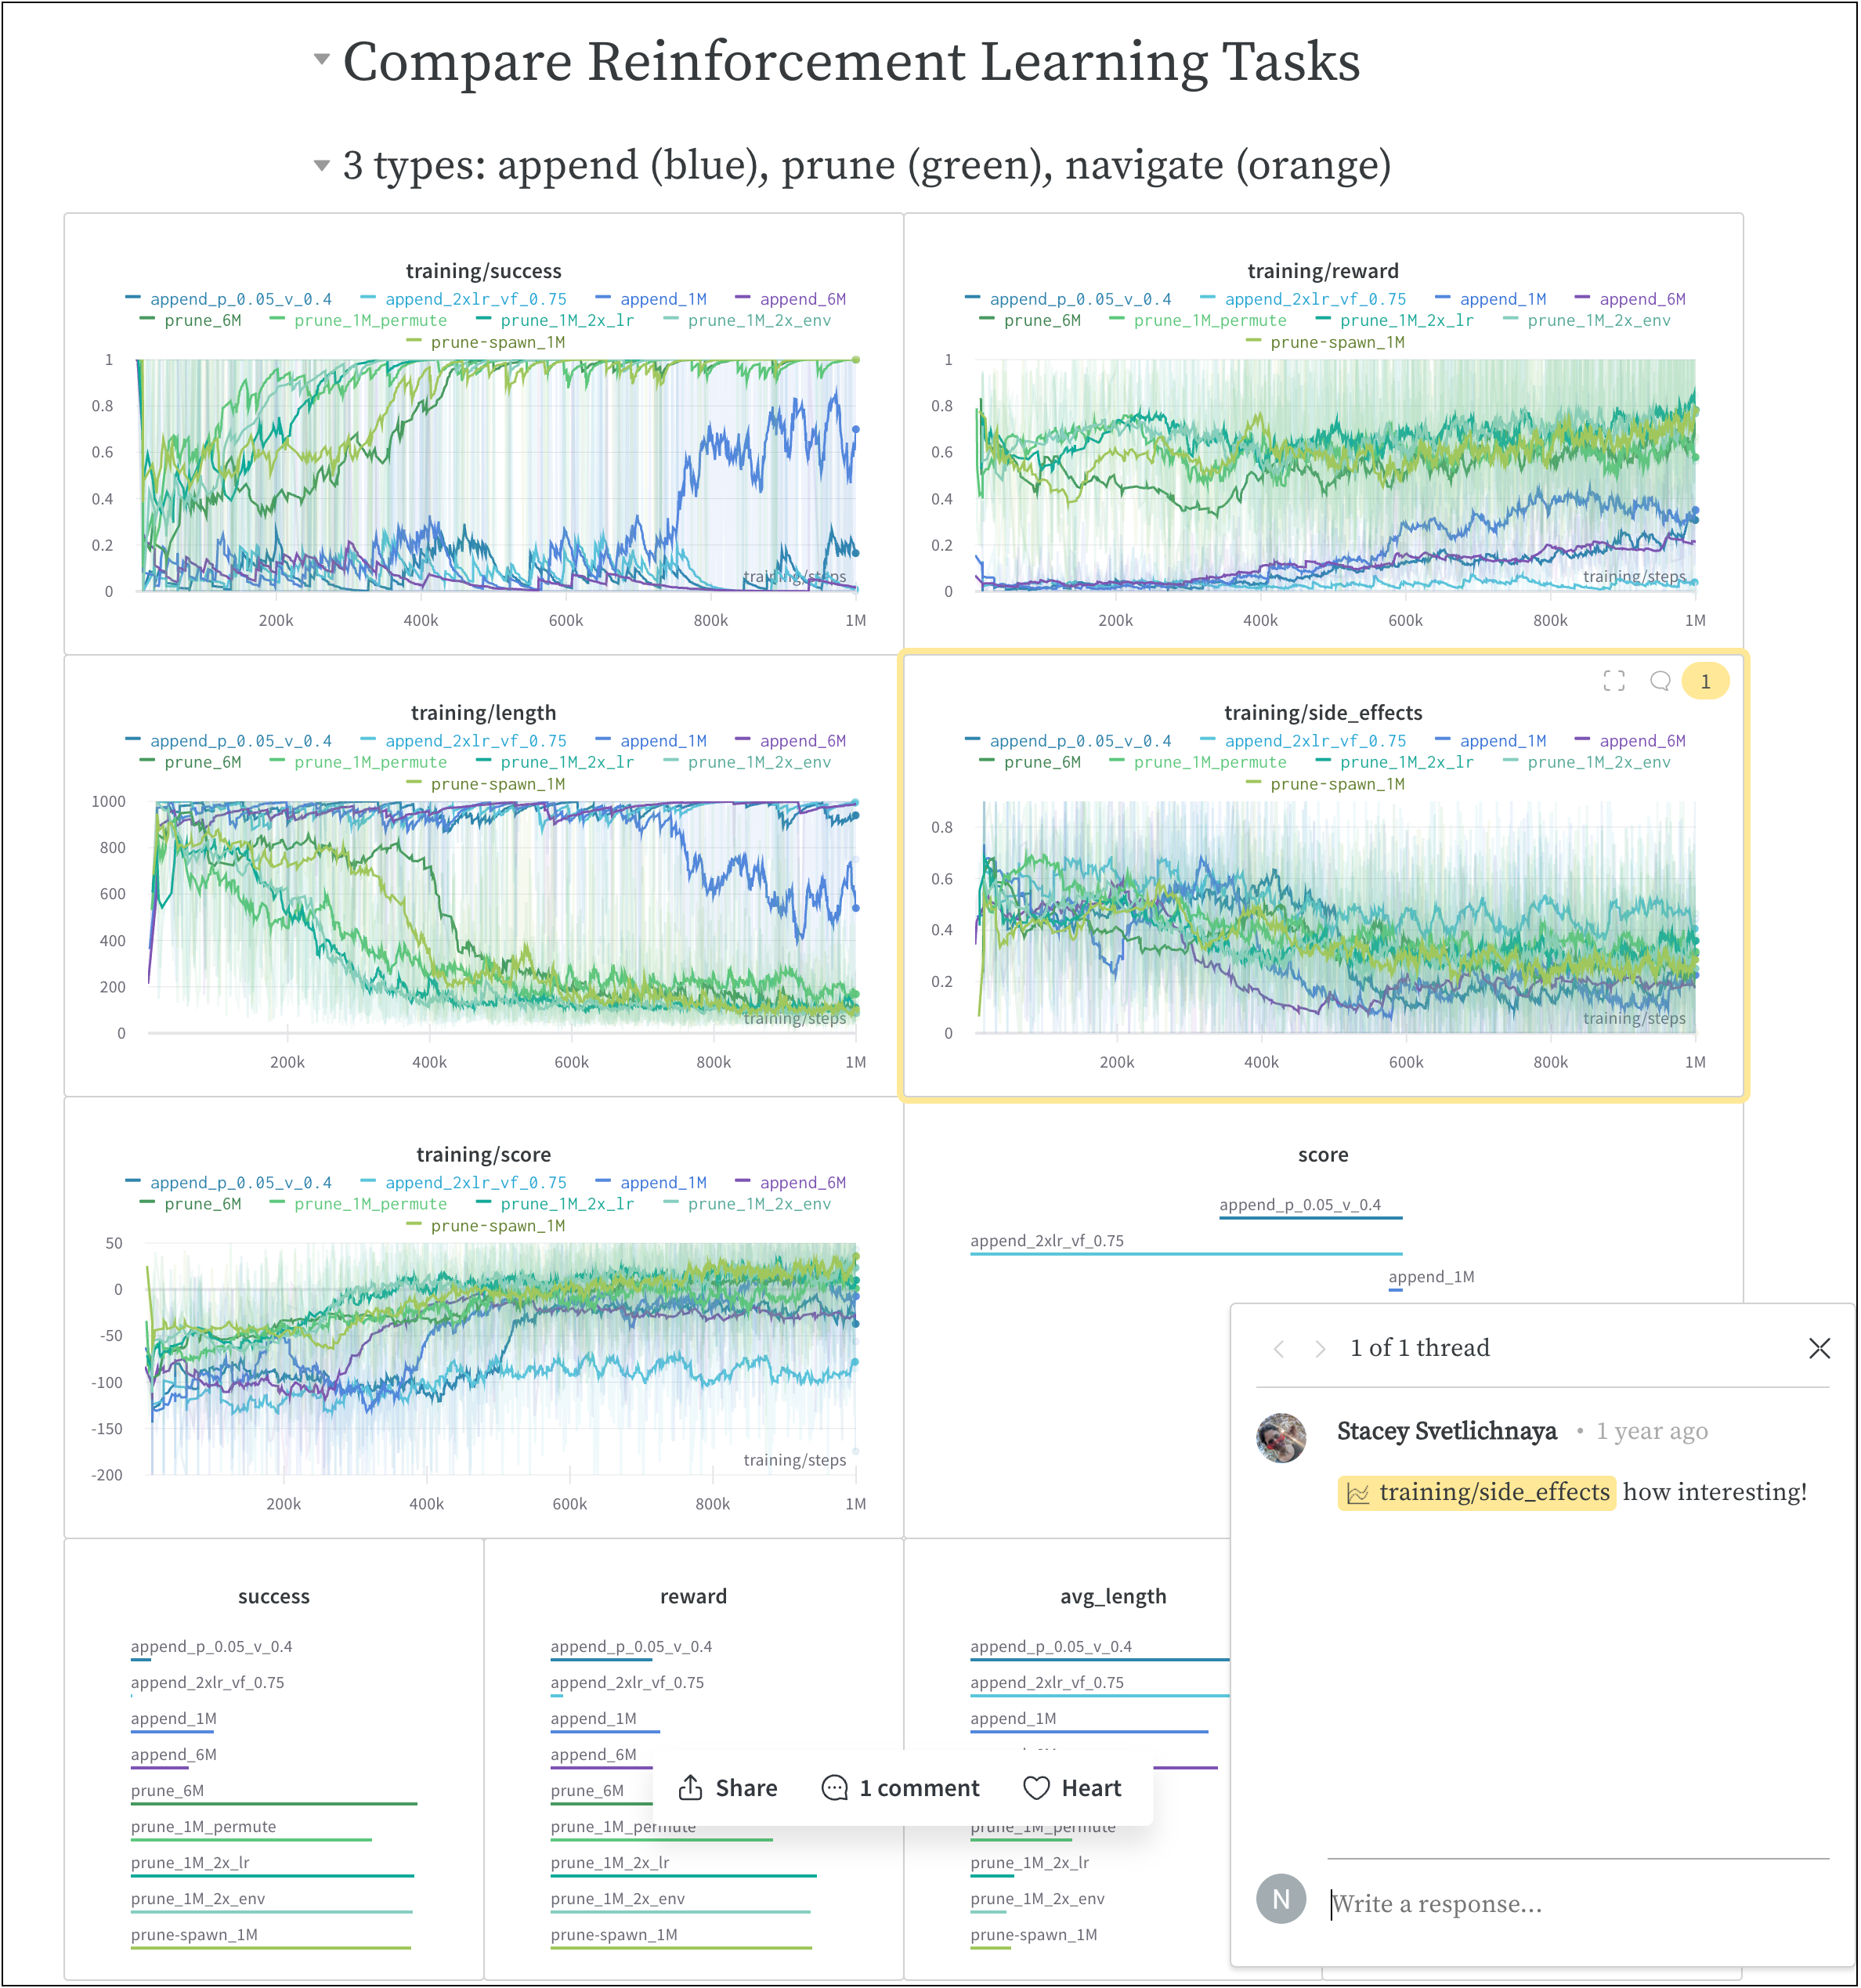 上記の画像の元となった レポート は [こちら](https://wandb.ai/stacey/saferlife/reports/SafeLife-Benchmark-Experiments--Vmlldzo0NjE4MzM) からご覧いただけます。
## 仕組み
数回のクリックで、コラボレーション可能な レポート を作成できます。
1. W\&B App で W\&B Projects の Workspace に移動します。
2. Workspace の右上にある **Create report** ボタンをクリックします。
上記の画像の元となった レポート は [こちら](https://wandb.ai/stacey/saferlife/reports/SafeLife-Benchmark-Experiments--Vmlldzo0NjE4MzM) からご覧いただけます。
## 仕組み
数回のクリックで、コラボレーション可能な レポート を作成できます。
1. W\&B App で W\&B Projects の Workspace に移動します。
2. Workspace の右上にある **Create report** ボタンをクリックします。
 3. **Create Report** というタイトルのモーダルが表示されます。 レポート に追加したいチャートや パネル を選択します(チャートや パネル は後で追加・削除が可能です)。
4. **Create report** をクリックします。
5. レポート をお好みの状態に編集します。
6. **Publish to project** をクリックします。
7. **Share** ボタンをクリックして、コラボレーターに レポート を共有します。
W\&B Python SDK を使用して、対話的またはプログラムによって レポート を作成する方法の詳細については、 [Create a report](/models/reports/create-a-report/) ページを参照してください。
## 開始方法
ユースケース に応じて、W\&B Reports を使い始めるための以下のリソースを活用してください:
* [ビデオデモ](https://www.youtube.com/watch?v=2xeJIv_K_eI) で W\&B Reports の概要を確認する。
* [Reports gallery](/models/reports/reports-gallery/) で公開されている レポート の例を見る。
* [Programmatic Workspaces](/models/tutorials/workspaces) チュートリアルで、 Workspace の作成とカスタマイズ方法を学ぶ。
* [W\&B Fully Connected](https://wandb.me/fc) で厳選された レポート を読む。
## 推奨されるプラクティスとヒント
Experiments や ログ に関する ベストプラスティス とヒントについては、 [Best Practices: Reports](https://wandb.ai/wandb/pytorch-lightning-e2e/reports/W-B-Best-Practices-Guide--VmlldzozNTU1ODY1#reports) を参照してください。
3. **Create Report** というタイトルのモーダルが表示されます。 レポート に追加したいチャートや パネル を選択します(チャートや パネル は後で追加・削除が可能です)。
4. **Create report** をクリックします。
5. レポート をお好みの状態に編集します。
6. **Publish to project** をクリックします。
7. **Share** ボタンをクリックして、コラボレーターに レポート を共有します。
W\&B Python SDK を使用して、対話的またはプログラムによって レポート を作成する方法の詳細については、 [Create a report](/models/reports/create-a-report/) ページを参照してください。
## 開始方法
ユースケース に応じて、W\&B Reports を使い始めるための以下のリソースを活用してください:
* [ビデオデモ](https://www.youtube.com/watch?v=2xeJIv_K_eI) で W\&B Reports の概要を確認する。
* [Reports gallery](/models/reports/reports-gallery/) で公開されている レポート の例を見る。
* [Programmatic Workspaces](/models/tutorials/workspaces) チュートリアルで、 Workspace の作成とカスタマイズ方法を学ぶ。
* [W\&B Fully Connected](https://wandb.me/fc) で厳選された レポート を読む。
## 推奨されるプラクティスとヒント
Experiments や ログ に関する ベストプラスティス とヒントについては、 [Best Practices: Reports](https://wandb.ai/wandb/pytorch-lightning-e2e/reports/W-B-Best-Practices-Guide--VmlldzozNTU1ODY1#reports) を参照してください。