> ## Documentation Index
> Fetch the complete documentation index at: https://wb-21fd5541-serverless-sft-revamp.mintlify.site/llms.txt
> Use this file to discover all available pages before exploring further.
# Experiments の概要
> W&B を使用して machine learning の Experiments を追跡します。
export const TryProductLink = ({url}) =>
Try in W&B
;
export const ColabLink = ({url}) =>
Try in Colab
;
数行のコードを追加するだけで、機械学習の実験を追跡できます。追跡した結果は [インタラクティブなダッシュボード](/models/track/workspaces/) で確認したり、[Public API](/models/ref/python/public-api/) を使用してプログラムからデータにアクセスし、Python へエクスポートしたりすることができます。
[Keras](/models/integrations/keras) や [Scikit](/models/integrations/scikit) などの主要なフレームワークを使用している場合は、W\&B のインテグレーションを活用してください。インテグレーションの全リストや、コードに W\&B を追加する方法については、[インテグレーションガイド](/models/integrations) を参照してください。
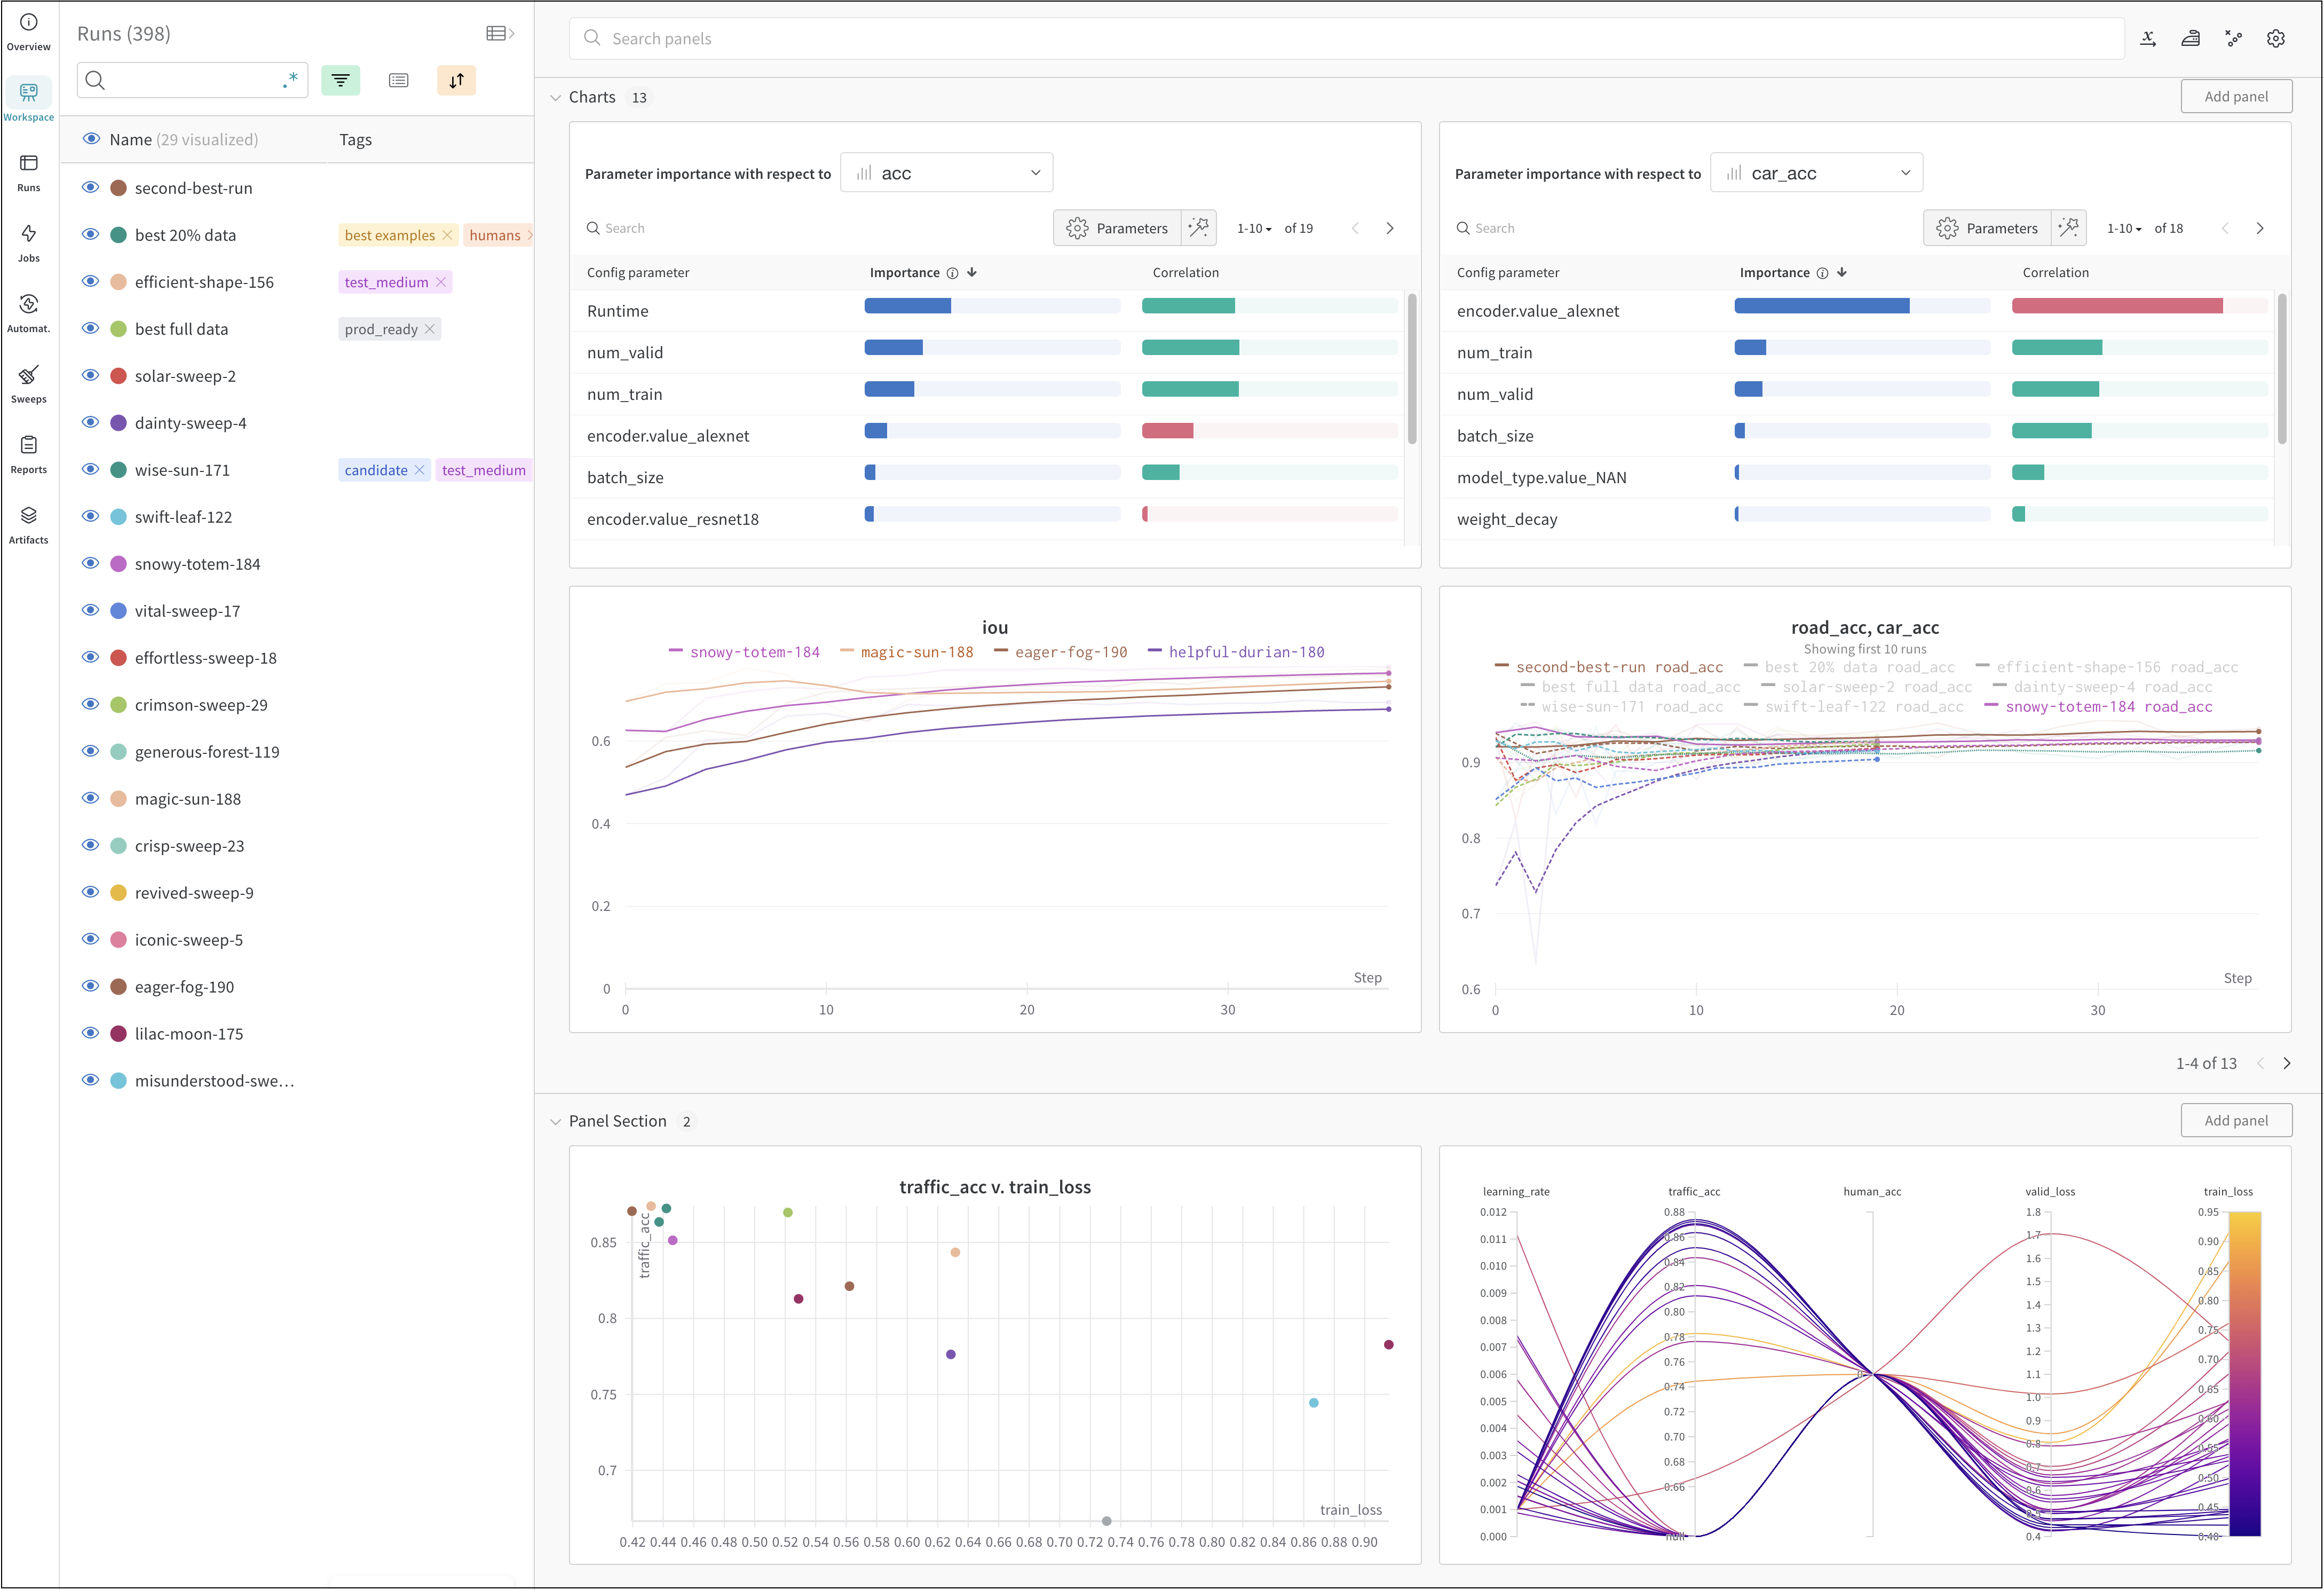 上の画像は、複数の [Runs](/models/runs/) にわたるメトリクスを表示し、比較できるダッシュボードの例です。
## 仕組み
以下の数ステップで、機械学習の実験を追跡できます。
1. [W\&B Run](/models/runs/) を作成します。
2. 学習率やモデルのタイプなどのハイパーパラメーターの辞書を、設定 ([`wandb.Run.config`](/models/track/config/)) に保存します。
3. トレーニングループ内で、精度 (accuracy) や損失 (loss) などのメトリクス ([`wandb.Run.log()`](/models/track/log/)) を時系列でログに記録します。
4. モデルの重みや予測結果のテーブルなど、run の出力を保存します。
以下のコードは、一般的な W\&B の実験管理ワークフローを示しています。
```python theme={null}
# Runを開始します。
#
# このブロックが終了すると、ログに記録されたデータのアップロードが完了するまで待機します。
# 例外が発生した場合、Runは失敗(failed)としてマークされます。
with wandb.init(entity="", project="my-project-name") as run:
# モデルの入力とハイパーパラメーターを保存します。
run.config.learning_rate = 0.01
# 実験コードを実行します。
for epoch in range(num_epochs):
# トレーニングの処理...
# モデルのパフォーマンスを可視化するために、メトリクスを時系列でログに記録します。
run.log({"loss": loss})
# モデルの出力をArtifactsとしてアップロードします。
run.log_artifact(model)
```
## クイックスタート
ユースケースに合わせて、W\&B Experiments を使い始めるための以下のリソースを確認してください。
* データセットの Artifacts を作成、追跡、使用するための W\&B Python SDK コマンドのステップバイステップの概要については、[W\&B クイックスタート](/models/quickstart/) をお読みください。
* このチャプターでは、以下の方法について詳しく説明します。
* 実験の作成
* 実験の設定
* 実験からのデータのログ記録
* 実験結果の表示
* [W\&B API リファレンスガイド](/models/ref/python/) 内の [W\&B Python ライブラリ](/models/ref/python/) を参照してください。
## ベストプラクティスとヒント
実験とログ記録に関するベストプラクティスとヒントについては、[Best Practices: Experiments and Logging](https://wandb.ai/wandb/pytorch-lightning-e2e/reports/W-B-Best-Practices-Guide--VmlldzozNTU1ODY1#w\&b-experiments-and-logging) をご覧ください。
上の画像は、複数の [Runs](/models/runs/) にわたるメトリクスを表示し、比較できるダッシュボードの例です。
## 仕組み
以下の数ステップで、機械学習の実験を追跡できます。
1. [W\&B Run](/models/runs/) を作成します。
2. 学習率やモデルのタイプなどのハイパーパラメーターの辞書を、設定 ([`wandb.Run.config`](/models/track/config/)) に保存します。
3. トレーニングループ内で、精度 (accuracy) や損失 (loss) などのメトリクス ([`wandb.Run.log()`](/models/track/log/)) を時系列でログに記録します。
4. モデルの重みや予測結果のテーブルなど、run の出力を保存します。
以下のコードは、一般的な W\&B の実験管理ワークフローを示しています。
```python theme={null}
# Runを開始します。
#
# このブロックが終了すると、ログに記録されたデータのアップロードが完了するまで待機します。
# 例外が発生した場合、Runは失敗(failed)としてマークされます。
with wandb.init(entity="", project="my-project-name") as run:
# モデルの入力とハイパーパラメーターを保存します。
run.config.learning_rate = 0.01
# 実験コードを実行します。
for epoch in range(num_epochs):
# トレーニングの処理...
# モデルのパフォーマンスを可視化するために、メトリクスを時系列でログに記録します。
run.log({"loss": loss})
# モデルの出力をArtifactsとしてアップロードします。
run.log_artifact(model)
```
## クイックスタート
ユースケースに合わせて、W\&B Experiments を使い始めるための以下のリソースを確認してください。
* データセットの Artifacts を作成、追跡、使用するための W\&B Python SDK コマンドのステップバイステップの概要については、[W\&B クイックスタート](/models/quickstart/) をお読みください。
* このチャプターでは、以下の方法について詳しく説明します。
* 実験の作成
* 実験の設定
* 実験からのデータのログ記録
* 実験結果の表示
* [W\&B API リファレンスガイド](/models/ref/python/) 内の [W\&B Python ライブラリ](/models/ref/python/) を参照してください。
## ベストプラクティスとヒント
実験とログ記録に関するベストプラクティスとヒントについては、[Best Practices: Experiments and Logging](https://wandb.ai/wandb/pytorch-lightning-e2e/reports/W-B-Best-Practices-Guide--VmlldzozNTU1ODY1#w\&b-experiments-and-logging) をご覧ください。