> ## Documentation Index
> Fetch the complete documentation index at: https://wb-21fd5541-serverless-sft-revamp.mintlify.site/llms.txt
> Use this file to discover all available pages before exploring further.
# 평행 좌표계 (Parallel coordinates)
> 기계학습 실험 간의 결과 비교
Parallel coordinates charts는 수많은 하이퍼파라미터와 모델 메트릭 간의 관계를 한눈에 요약하여 보여줍니다.
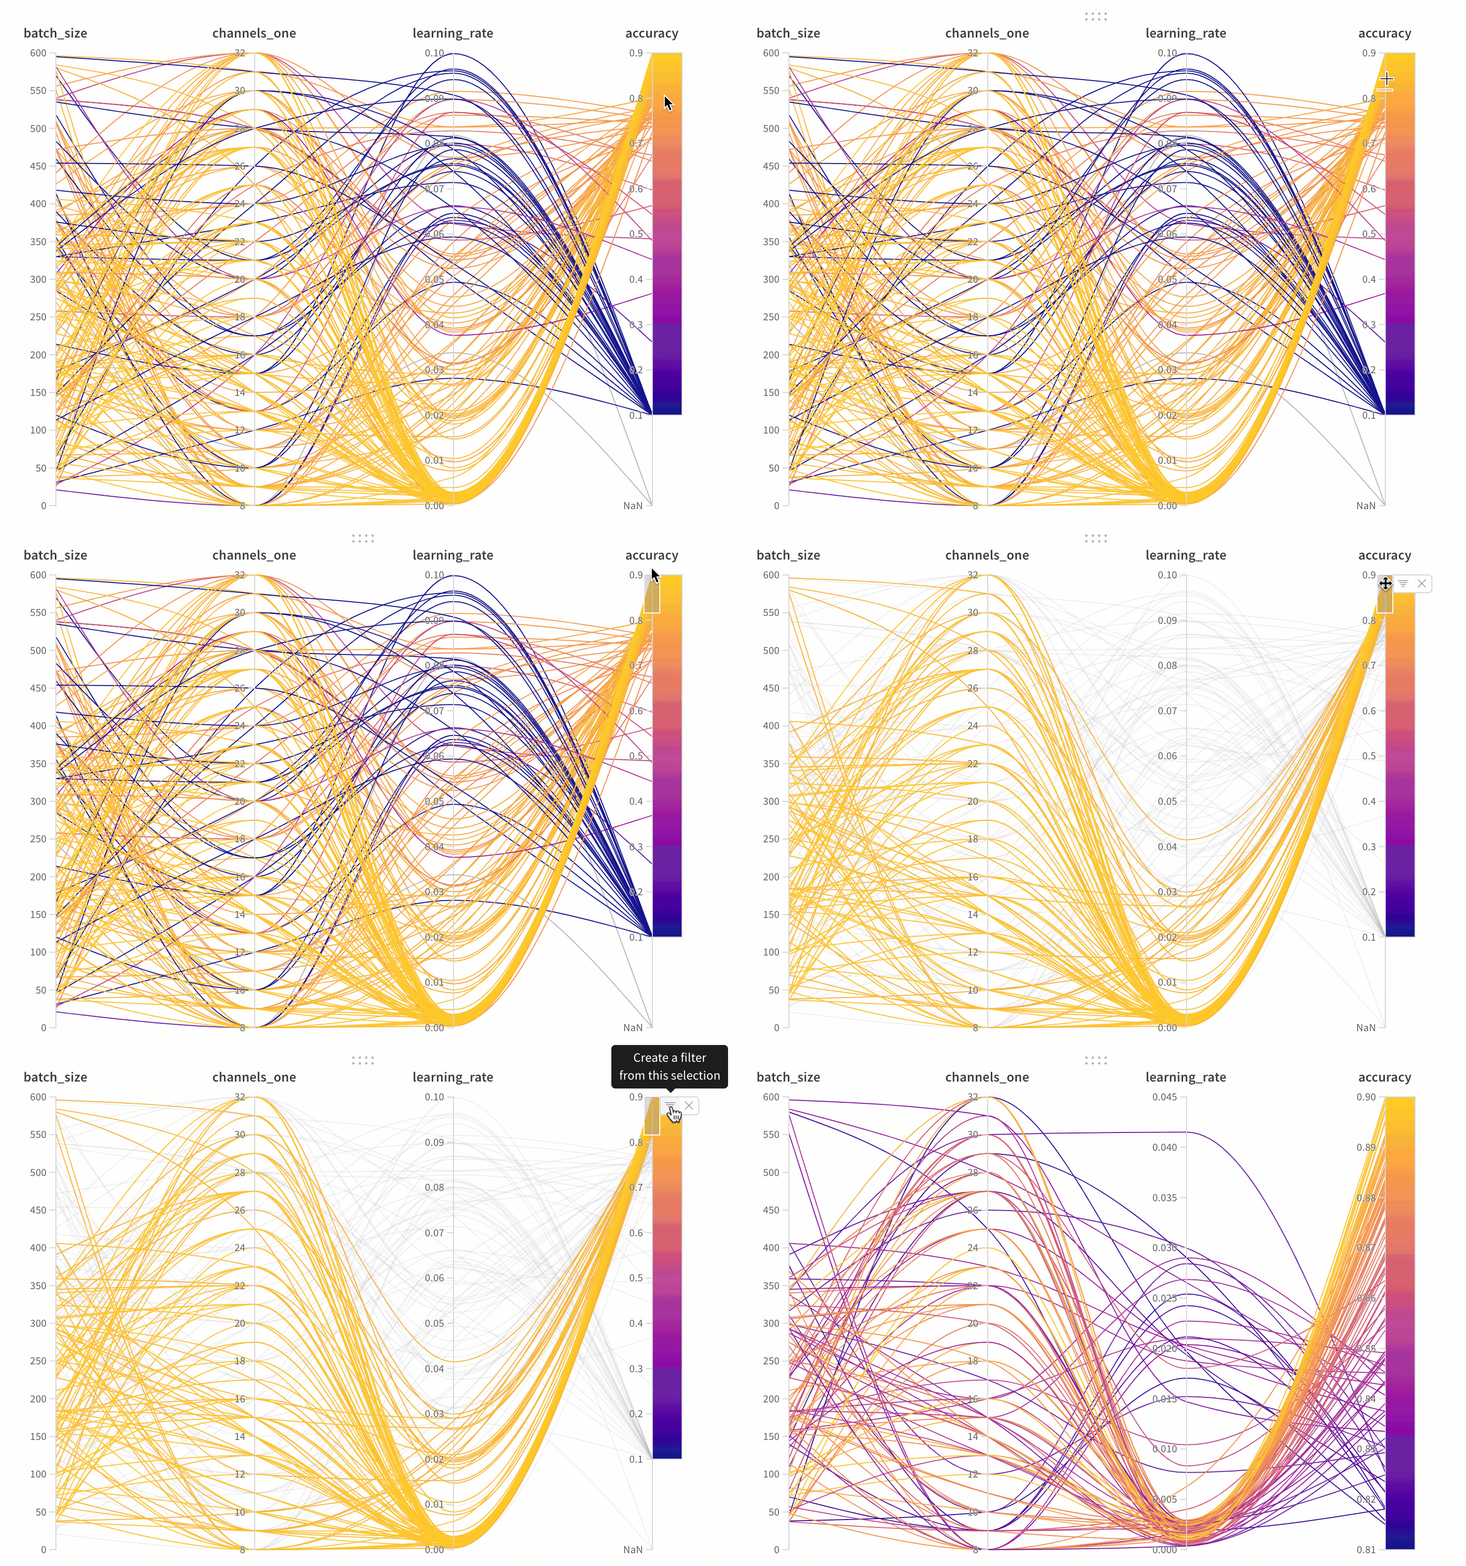 * **Axes**: [`wandb.Run.config`](/models/evaluate-models/)의 다양한 하이퍼파라미터와 [`wandb.Run.log()`](/models/evaluate-models/)의 메트릭을 나타냅니다.
* **Lines**: 각 선은 하나의 run을 나타냅니다. 선 위에 마우스를 올리면 해당 run에 대한 상세 정보가 포함된 툴팁이 표시됩니다. 현재 필터와 일치하는 모든 선이 표시되지만, 눈 아이콘을 끄면 해당 선들은 회색으로 처리됩니다.
## parallel coordinates 패널 생성하기
1. Workspace의 랜딩 페이지로 이동합니다.
2. **Add Panels**를 클릭합니다.
3. **Parallel coordinates**를 선택합니다.
## 패널 설정
패널을 구성하려면 패널 오른쪽 상단의 편집 버튼을 클릭하세요.
* **Tooltip**: 마우스를 올리면 각 run에 대한 정보가 담긴 범례가 표시됩니다.
* **Titles**: 축 제목을 읽기 쉽게 편집합니다.
* **Gradient**: 그레이디언트를 원하는 색상 범위로 커스터마이징합니다.
* **Log scale**: 각 축을 독립적으로 로그 스케일로 설정하여 볼 수 있습니다.
* **Flip axis**: 축의 방향을 바꿉니다. 정확도(accuracy)와 손실(loss)이 모두 컬럼으로 포함되어 있을 때 유용합니다.
[실제 parallel coordinates 패널과 상호작용해 보기](https://app.wandb.ai/example-team/sweep-demo/reports/Zoom-in-on-Parallel-Coordinates-Charts--Vmlldzo5MTQ4Nw)
* **Axes**: [`wandb.Run.config`](/models/evaluate-models/)의 다양한 하이퍼파라미터와 [`wandb.Run.log()`](/models/evaluate-models/)의 메트릭을 나타냅니다.
* **Lines**: 각 선은 하나의 run을 나타냅니다. 선 위에 마우스를 올리면 해당 run에 대한 상세 정보가 포함된 툴팁이 표시됩니다. 현재 필터와 일치하는 모든 선이 표시되지만, 눈 아이콘을 끄면 해당 선들은 회색으로 처리됩니다.
## parallel coordinates 패널 생성하기
1. Workspace의 랜딩 페이지로 이동합니다.
2. **Add Panels**를 클릭합니다.
3. **Parallel coordinates**를 선택합니다.
## 패널 설정
패널을 구성하려면 패널 오른쪽 상단의 편집 버튼을 클릭하세요.
* **Tooltip**: 마우스를 올리면 각 run에 대한 정보가 담긴 범례가 표시됩니다.
* **Titles**: 축 제목을 읽기 쉽게 편집합니다.
* **Gradient**: 그레이디언트를 원하는 색상 범위로 커스터마이징합니다.
* **Log scale**: 각 축을 독립적으로 로그 스케일로 설정하여 볼 수 있습니다.
* **Flip axis**: 축의 방향을 바꿉니다. 정확도(accuracy)와 손실(loss)이 모두 컬럼으로 포함되어 있을 때 유용합니다.
[실제 parallel coordinates 패널과 상호작용해 보기](https://app.wandb.ai/example-team/sweep-demo/reports/Zoom-in-on-Parallel-Coordinates-Charts--Vmlldzo5MTQ4Nw)