> ## Documentation Index
> Fetch the complete documentation index at: https://wb-21fd5541-serverless-sft-revamp.mintlify.site/llms.txt
> Use this file to discover all available pages before exploring further.
# thoughtful_
Reports 개요
> 기계학습 프로젝트를 위한 프로젝트 관리 및 협업 툴
export const TryProductLink = ({url}) =>
Try in W&B
;
export const ColabLink = ({url}) =>
Try in Colab
;
W\&B Reports 를 사용하여 다음 작업을 수행할 수 있습니다:
* Runs 정리.
* 시각화 임베드 및 자동화.
* 발견한 내용 (findings) 기술.
* LaTeX zip 파일 또는 PDF 형식으로 협업자들과 업데이트 공유.
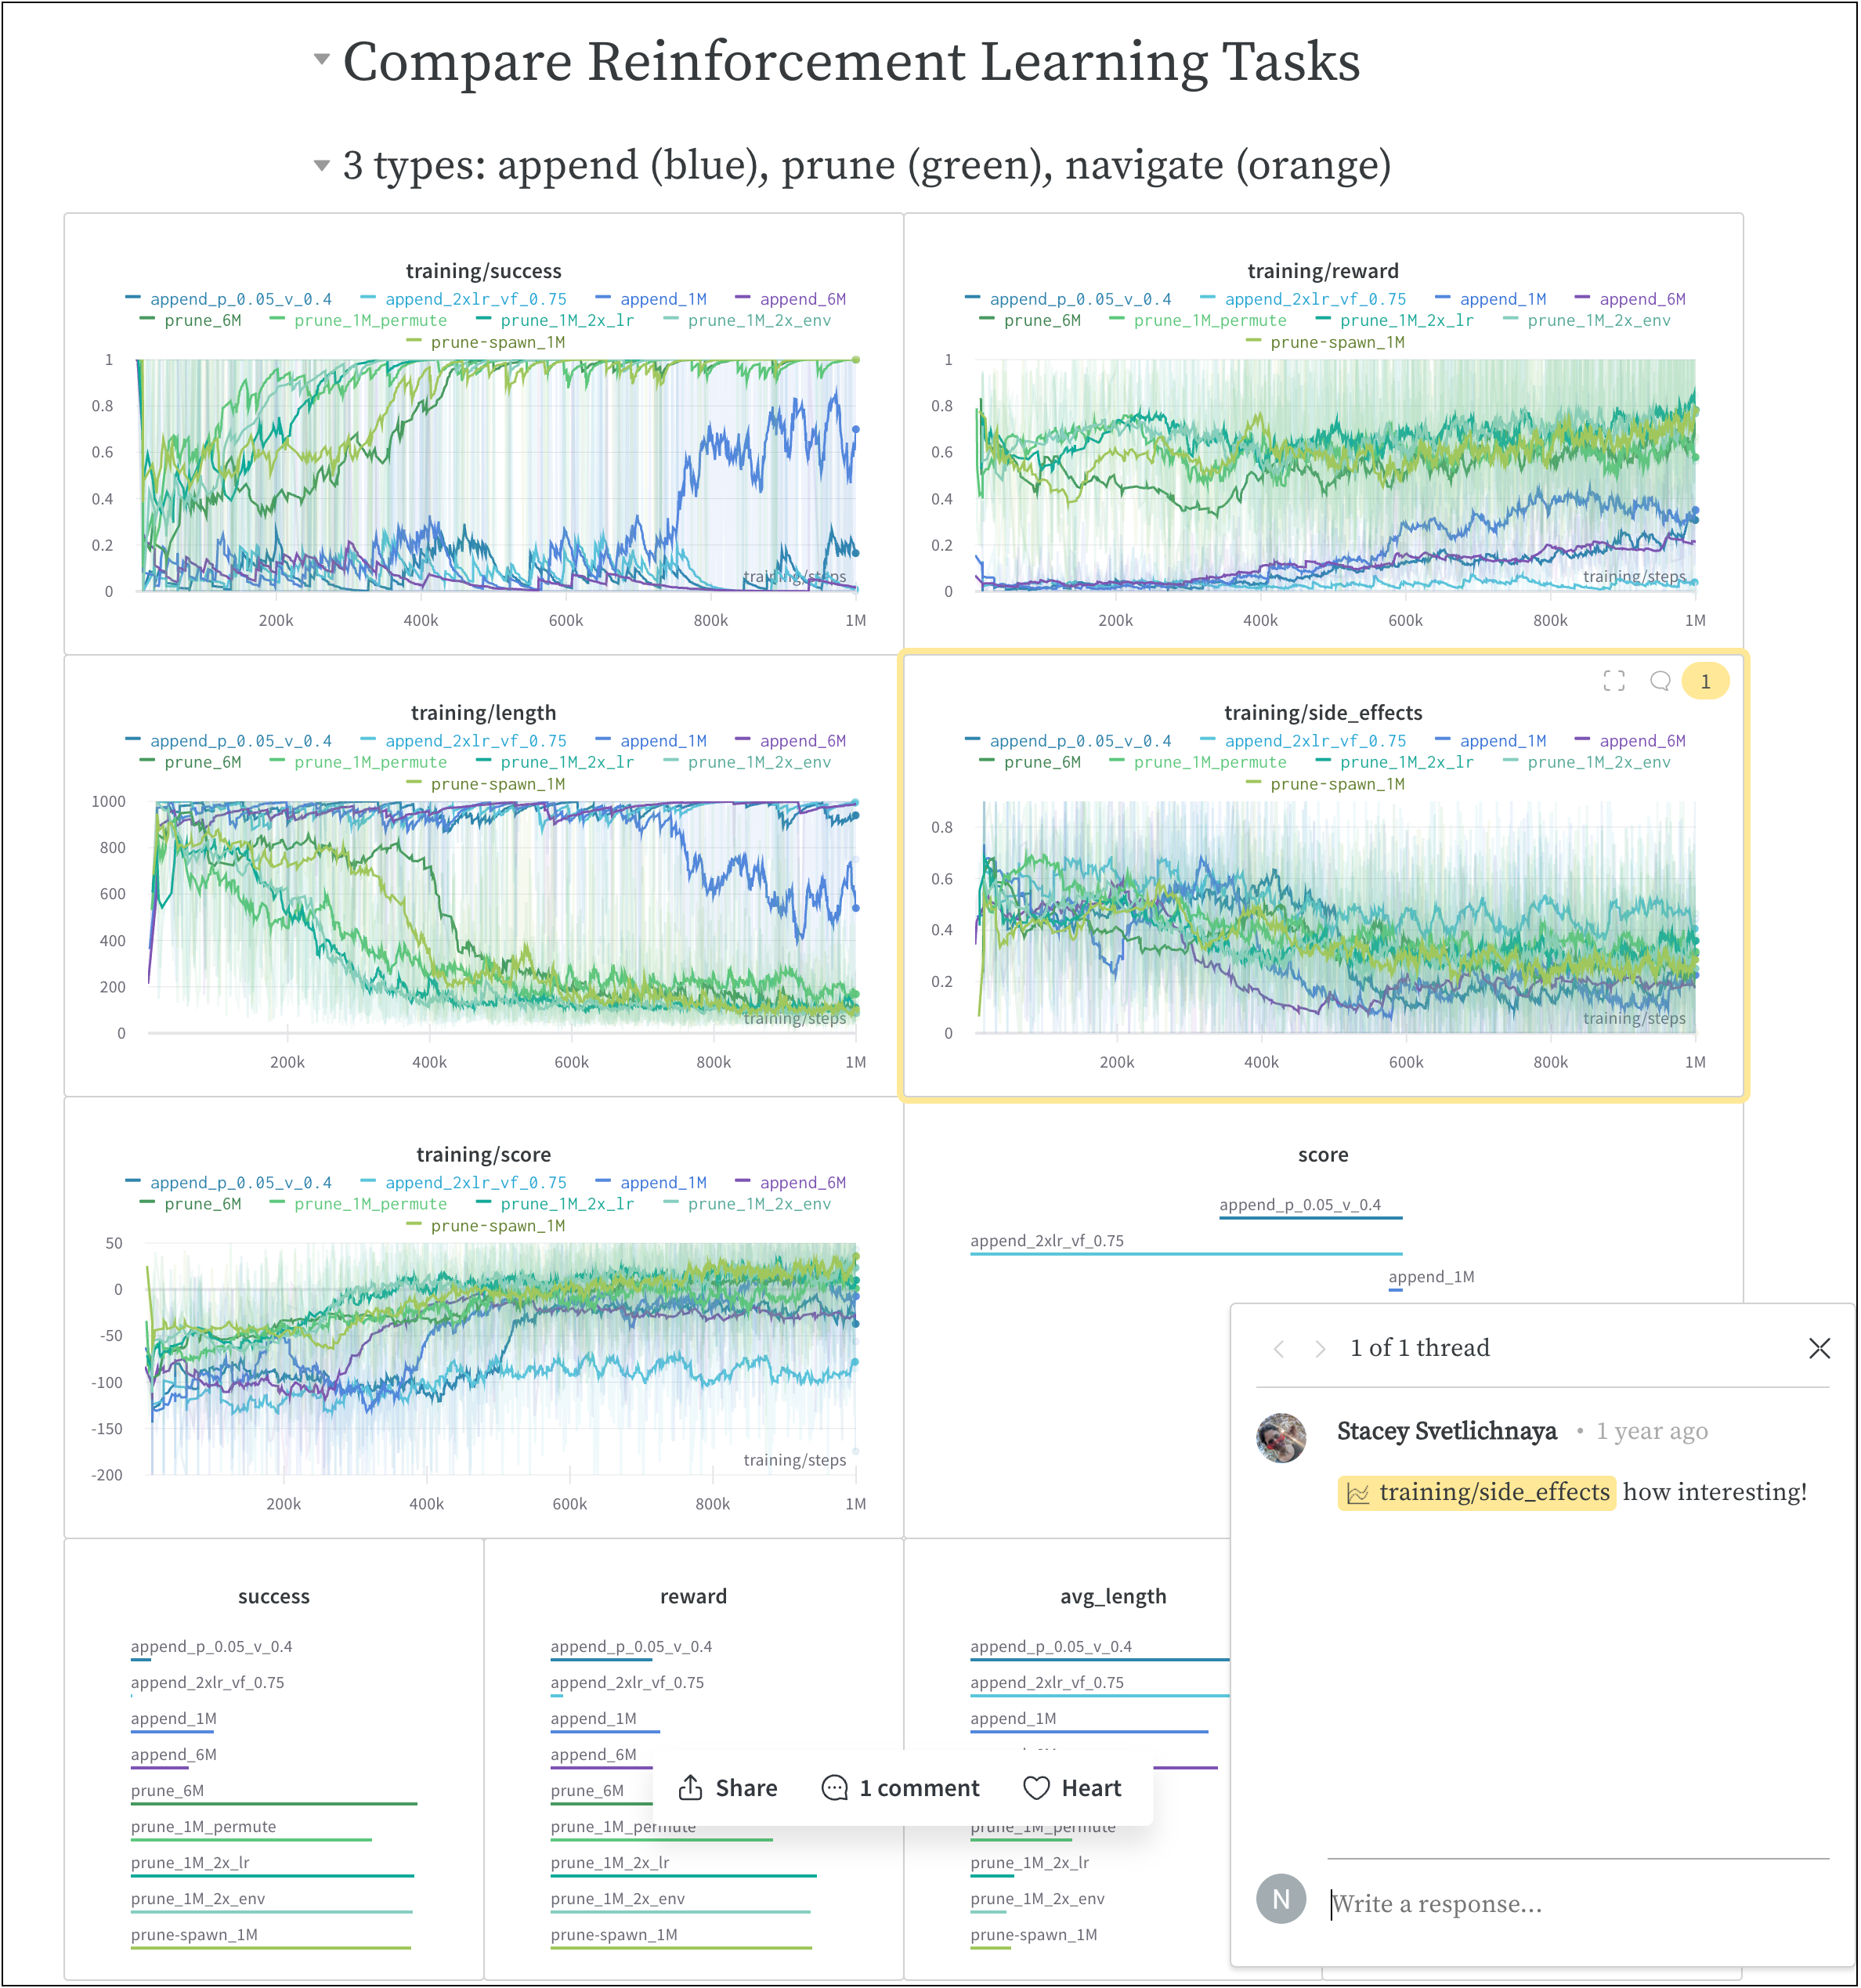
다음 이미지는 트레이닝 과정 동안 W\&B 에 로그된 메트릭으로 생성된 리포트의 일부를 보여줍니다.
위 이미지가 포함된 전체 리포트는 [여기](https://wandb.ai/stacey/saferlife/reports/SafeLife-Benchmark-Experiments--Vmlldzo0NjE4MzM)에서 확인할 수 있습니다.
## 작동 방식
몇 번의 클릭만으로 협업용 리포트를 생성할 수 있습니다.
1. W\&B 앱에서 해당 W\&B 프로젝트 Workspace 로 이동합니다.
2. Workspace 오른쪽 상단에 있는 **Create report** 버튼을 클릭합니다.
3. **Create Report** 라는 제목의 모달이 나타납니다. 리포트에 추가할 차트와 패널을 선택합니다. (차트와 패널은 나중에 추가하거나 삭제할 수 있습니다).
4. **Create report** 를 클릭합니다.
5. 원하는 상태로 리포트를 편집합니다.
6. **Publish to project** 를 클릭합니다.
7. **Share** 버튼을 클릭하여 협업자들과 리포트를 공유합니다.
인터랙티브하게 또는 W\&B Python SDK 를 사용하여 프로그래밍 방식으로 리포트를 생성하는 방법에 대한 자세한 내용은 [리포트 생성하기](/models/reports/create-a-report/) 페이지를 참조하세요.
## 시작 방법
유스 케이스에 따라 W\&B Reports 를 시작하기 위한 다음 리소스를 살펴보세요:
* W\&B Reports 에 대한 개요를 보려면 [데모 비디오](https://www.youtube.com/watch?v=2xeJIv_K_eI)를 확인하세요.
* 실제 리포트 예시를 보려면 [Reports gallery](/models/reports/reports-gallery/)를 살펴보세요.
* Workspace 를 생성하고 커스터마이징하는 방법을 배우려면 [Programmatic Workspaces](/models/tutorials/workspaces) 튜토리얼을 시도해 보세요.
* [W\&B Fully Connected](https://wandb.me/fc)에서 엄선된 Reports 를 읽어보세요.
## 권장 모범 사례 및 팁
Experiments 및 로깅에 대한 모범 사례와 팁은 [Best Practices: Reports](https://wandb.ai/wandb/pytorch-lightning-e2e/reports/W-B-Best-Practices-Guide--VmlldzozNTU1ODY1#reports)를 참조하세요.
 위 이미지가 포함된 전체 리포트는 [여기](https://wandb.ai/stacey/saferlife/reports/SafeLife-Benchmark-Experiments--Vmlldzo0NjE4MzM)에서 확인할 수 있습니다.
## 작동 방식
몇 번의 클릭만으로 협업용 리포트를 생성할 수 있습니다.
1. W\&B 앱에서 해당 W\&B 프로젝트 Workspace 로 이동합니다.
2. Workspace 오른쪽 상단에 있는 **Create report** 버튼을 클릭합니다.
위 이미지가 포함된 전체 리포트는 [여기](https://wandb.ai/stacey/saferlife/reports/SafeLife-Benchmark-Experiments--Vmlldzo0NjE4MzM)에서 확인할 수 있습니다.
## 작동 방식
몇 번의 클릭만으로 협업용 리포트를 생성할 수 있습니다.
1. W\&B 앱에서 해당 W\&B 프로젝트 Workspace 로 이동합니다.
2. Workspace 오른쪽 상단에 있는 **Create report** 버튼을 클릭합니다.
 3. **Create Report** 라는 제목의 모달이 나타납니다. 리포트에 추가할 차트와 패널을 선택합니다. (차트와 패널은 나중에 추가하거나 삭제할 수 있습니다).
4. **Create report** 를 클릭합니다.
5. 원하는 상태로 리포트를 편집합니다.
6. **Publish to project** 를 클릭합니다.
7. **Share** 버튼을 클릭하여 협업자들과 리포트를 공유합니다.
인터랙티브하게 또는 W\&B Python SDK 를 사용하여 프로그래밍 방식으로 리포트를 생성하는 방법에 대한 자세한 내용은 [리포트 생성하기](/models/reports/create-a-report/) 페이지를 참조하세요.
## 시작 방법
유스 케이스에 따라 W\&B Reports 를 시작하기 위한 다음 리소스를 살펴보세요:
* W\&B Reports 에 대한 개요를 보려면 [데모 비디오](https://www.youtube.com/watch?v=2xeJIv_K_eI)를 확인하세요.
* 실제 리포트 예시를 보려면 [Reports gallery](/models/reports/reports-gallery/)를 살펴보세요.
* Workspace 를 생성하고 커스터마이징하는 방법을 배우려면 [Programmatic Workspaces](/models/tutorials/workspaces) 튜토리얼을 시도해 보세요.
* [W\&B Fully Connected](https://wandb.me/fc)에서 엄선된 Reports 를 읽어보세요.
## 권장 모범 사례 및 팁
Experiments 및 로깅에 대한 모범 사례와 팁은 [Best Practices: Reports](https://wandb.ai/wandb/pytorch-lightning-e2e/reports/W-B-Best-Practices-Guide--VmlldzozNTU1ODY1#reports)를 참조하세요.
3. **Create Report** 라는 제목의 모달이 나타납니다. 리포트에 추가할 차트와 패널을 선택합니다. (차트와 패널은 나중에 추가하거나 삭제할 수 있습니다).
4. **Create report** 를 클릭합니다.
5. 원하는 상태로 리포트를 편집합니다.
6. **Publish to project** 를 클릭합니다.
7. **Share** 버튼을 클릭하여 협업자들과 리포트를 공유합니다.
인터랙티브하게 또는 W\&B Python SDK 를 사용하여 프로그래밍 방식으로 리포트를 생성하는 방법에 대한 자세한 내용은 [리포트 생성하기](/models/reports/create-a-report/) 페이지를 참조하세요.
## 시작 방법
유스 케이스에 따라 W\&B Reports 를 시작하기 위한 다음 리소스를 살펴보세요:
* W\&B Reports 에 대한 개요를 보려면 [데모 비디오](https://www.youtube.com/watch?v=2xeJIv_K_eI)를 확인하세요.
* 실제 리포트 예시를 보려면 [Reports gallery](/models/reports/reports-gallery/)를 살펴보세요.
* Workspace 를 생성하고 커스터마이징하는 방법을 배우려면 [Programmatic Workspaces](/models/tutorials/workspaces) 튜토리얼을 시도해 보세요.
* [W\&B Fully Connected](https://wandb.me/fc)에서 엄선된 Reports 를 읽어보세요.
## 권장 모범 사례 및 팁
Experiments 및 로깅에 대한 모범 사례와 팁은 [Best Practices: Reports](https://wandb.ai/wandb/pytorch-lightning-e2e/reports/W-B-Best-Practices-Guide--VmlldzozNTU1ODY1#reports)를 참조하세요.